A+ Content is the rich media widget on the Amazon product detail page. Through visual assets, brands communicate unique product and brand value to help customers make informed purchase decisions. Selling partners using high-quality A+ Content boost their sales by 8–20 percent compared to those without it. A wide variety of brands, from established brands with large in-house design teams to bootstrapped brands with limited resources, use A+ Content, creating inconsistency in content quality. A typical A+ Content project combines text, images, and video into a cohesive product story. Evaluating each asset in isolation misses the quality that emerges from how those assets work together. When your content spans multiple heterogeneous modules and you need a holistic quality signal rather than per-asset checks, the multi-model fusion approach described in this post can help. In this post, we examine this problem in the context of A+ Content.
A+ Content provides creative freedom for selling partners to express their authentic selves on their product detail pages, without strict content specifications such as image ratio and text word count.
Although this flexibility allows compelling brand storytelling, it also creates substantial variation in content composition and quality.
With quality evaluation and improvement recommendations, brands can transform average content into high-quality content that is more coherent, relevant, and useful. This improved content helps customers make more informed purchasing decisions and build lasting relationships with brands, leading to improved revenue for selling partners.
To achieve this goal, an evaluation system must assess the complete content experience, provide actionable recommendations beyond numeric scores, and reflect the nuances across product categories. Existing approaches struggle to meet all these requirements simultaneously, so in this post, you will see a new approach using Vision-Language Models (VLMs) to understand and evaluate content holistically, and a diffusion-based generation component that produces improved visual assets from the resulting quality signals.
In this post, you will learn how to:
- Render complete ecommerce content as a single snapshot and evaluate it holistically with a VLM.
- Combine VLM semantic scores with OCR readability signals in a lightweight CatBoost classifier trained on expert annotations.
- Use SHAP to explain quality decisions and generate actionable improvement recommendations for selling partners.
- Implement the end-to-end pipeline on Amazon SageMaker AI, from data ingestion and annotation through model hosting, explainability, and production monitoring.
Opportunities and challenges in VLM-based evaluation
A vision language model (VLM) pairs an image encoder with a large language model (LLM). The encoder, often a vision transformer (ViT), splits an image into patches and turns them into embeddings, and a small connector maps those embeddings into the language model’s input space (Flamingo, LLaVA). Many VLMs reuse the image encoder from CLIP, which learned to match images with their captions. Because VLMs are trained to follow instructions, you can give one an image along with a rubric of evaluation criteria and get back a written assessment without task-specific training. When you need closer agreement with human reviewers, you can fine-tune the model on labeled examples. This makes VLMs a practical starting point for checking product images against your content guidelines at scale.
Conventional computer vision models can already score individual assets, for example flagging a blurry image or a grammar error in a bullet list. Using a VLM to grade each asset separately adds little beyond that. A product detail page, however, combines images, text, and layout modules into a single story, and its quality depends on how those pieces work together. Our approach renders the full page as a single snapshot and asks the VLM to evaluate it as customers see it.
Consider a blender page with a hero image, a bulleted feature list highlighting blade speed and capacity, and a lifestyle photo of the blender in a modern kitchen. Checked one by one, each asset passes: the image is sharp, the bullets are grammatical, and the photo is well lit. Viewed together, problems appear. The bullets might advertise a 64-oz pitcher while the lifestyle photo shows a single-serve model, or the lifestyle photo might sit above the hero image so customers see the kitchen before the product. Because an asset’s meaning depends on where it appears and what surrounds it, these issues only show up when the page is evaluated as a whole. The snapshot gives the VLM that complete view. Using it in production adds three requirements: scores must match expert quality standards, evaluation must be accurate and efficient at scale, and each result must explain what to fix.
As shown in Figure 1, we address these considerations through a VLM-based multi-model fusion architecture designed around adaptability, performance, and explainability. The following sections describe each component.
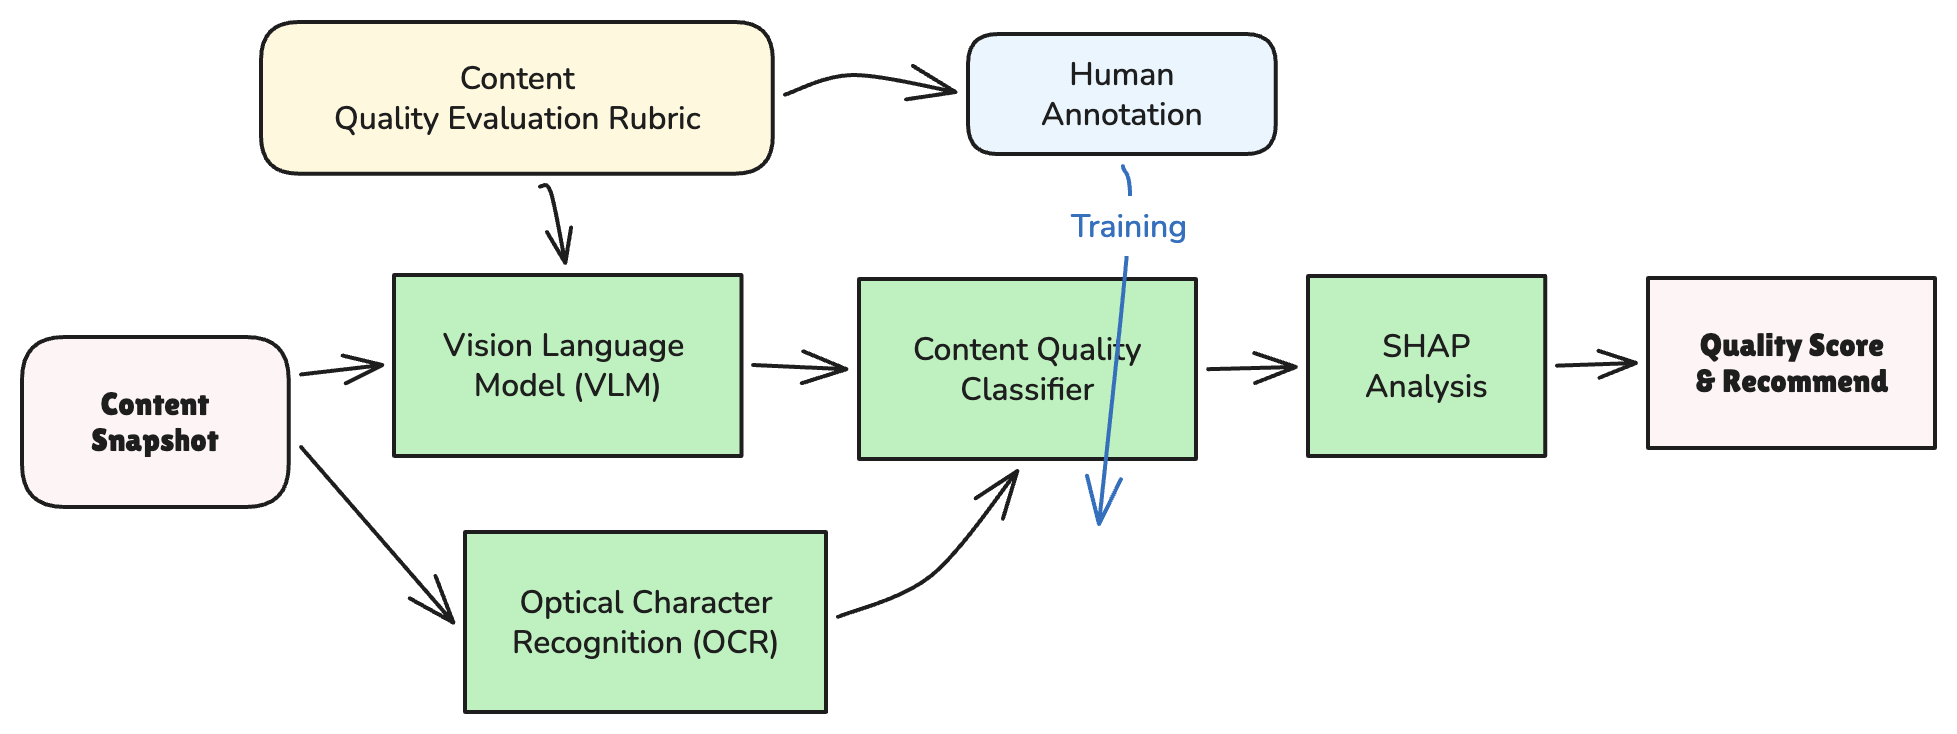
Figure 1: Block diagram of the VLM-based multi-model fusion approach, including VLM, OCR, and classifier models
Adaptive VLM content evaluation with expert annotations
A pretrained VLM prompted with a rubric scores content from its general knowledge, and those scores don’t always match ecommerce quality standards. Fine-tuning the VLM to close that gap would require GPU training infrastructure and, with only a few thousand labeled examples, carries a real risk of overfitting. Instead, we keep the VLM and rubric prompt fixed, use the VLM’s structured outputs as features, and train a CatBoost classifier on them to predict expert quality labels. CatBoost, a gradient-boosted decision tree library, performs well on small tabular datasets like this one. Because only the classifier is retrained, updating the system as annotations accumulate or criteria change takes a short CPU-only job rather than a foundation model fine-tuning run.
The VLM receives the page snapshot and a rubric prompt covering four quality dimensions: Visual Storytelling, Feature Presentation, A+ Layout, and Conversion Optimization. Each dimension has explicit criteria and point-deduction rules. For each dimension, the VLM returns a score from 0 to 10, a confidence value, and a natural-language rationale. For example, it lowers the score and explains why when a page lacks diverse modules or lifestyle imagery, or repeats information. The scores and confidence values become the classifier’s features, and the rationales help selling partners understand the result.
To build the training labels, one ecommerce marketing expert and four professional annotators independently rated 5,478 product detail pages from 10 product categories as high or low quality, using the same criteria. We assessed their ratings and took the majority vote to create a consensus label. The classes are nearly balanced (49.6 percent high quality), so a classifier can’t score well by predicting the majority class. To measure label reliability, we used Cohen’s kappa, which measures how often two raters agree after accounting for the agreement they would reach by chance. A score of 0 means agreement is no better than chance, 1 means perfect agreement, and values above 0.8 are generally considered strong. Each annotator scored between 0.845 and 0.915 when compared against the consensus label.
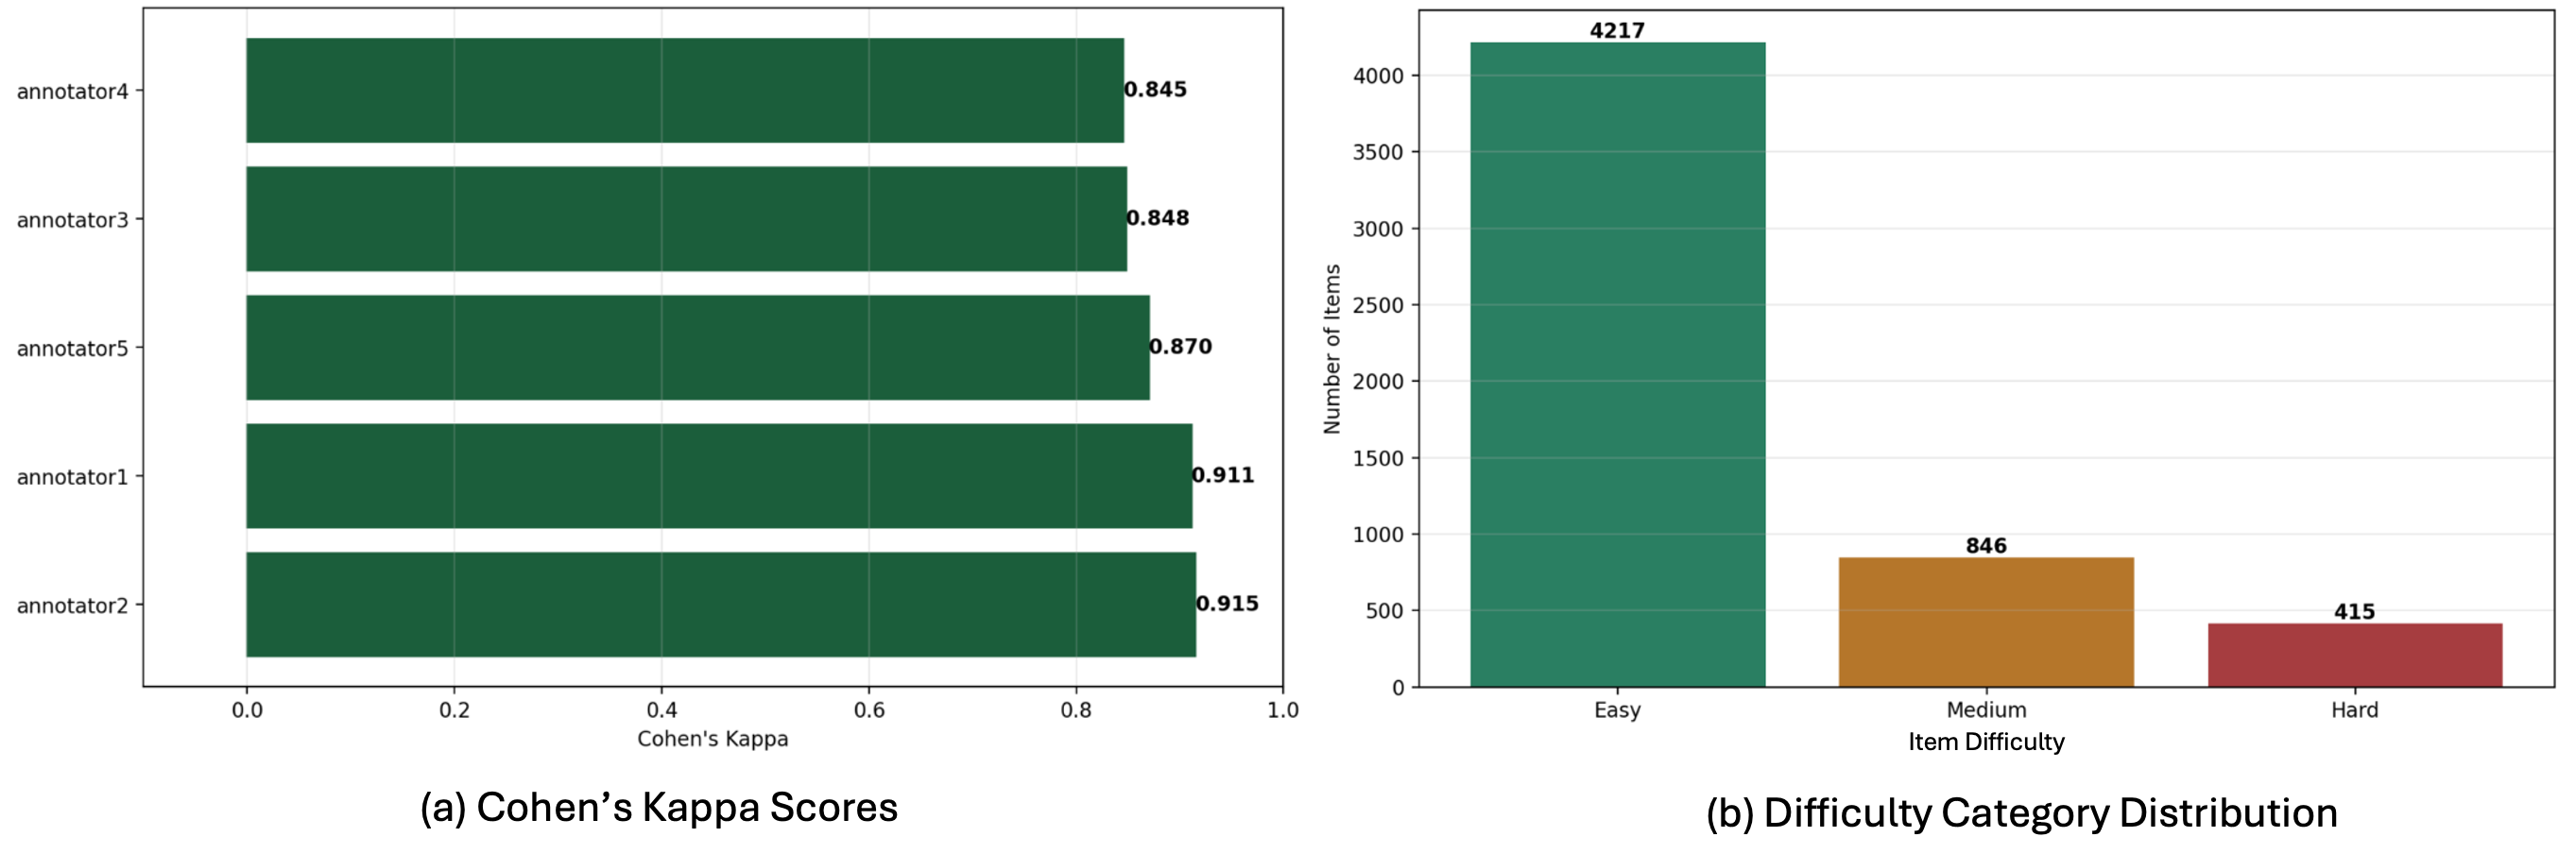
Figure 2: Annotator performance and content difficulty distribution. The near-even class split rules out majority-class bias (left), and the difficulty distribution explains the residual disagreement (right)
We compared the classifier with a baseline on a 20 percent holdout set (about 1,100 pages). The baseline averages the four VLM scores and applies a fixed threshold, so every dimension counts equally. The baseline reached 0.80 accuracy and an F1 score of 0.84 on the high-quality class. The CatBoost classifier, trained on the same scores, reached 0.89 accuracy and an F1 score of 0.90. Because the classifier learns how much each dimension matters and how the dimensions interact, its predictions match expert decisions more closely.
High-performance VLM content evaluation with OCR
VLMs capture the overall meaning and visual composition of a page well, but they are less reliable at fine-grained readability issues, such as how crowded the text is or how much space separates lines. Because of their language-model foundation, they can also favor long, detailed descriptions even when customers prefer concise text they can scan quickly. On a text-heavy page, a VLM might rate dense product information as helpful while customers struggle to read long sentences packed into a small area. To capture these issues, we use an optical character recognition (OCR) model hosted on SageMaker AI Inference to extract each block of text and its position, then calculate four quantitative signals: Text Density, Character Density, Spacing, and Overall Readability. Combining these OCR scores with the VLM’s semantic and visual assessment adds complementary information that improves quality classification.
From that output, we calculate four readability scores:
- Text Density: The share of the page area covered by text.
- Character Density: The number of characters per unit of page area.
- Spacing: How consistent and sufficient the whitespace is between words, lines, and paragraphs.
- Overall Readability: A combined signal from the three preceding scores.
Because these scores depend on layout rather than wording, two pages with identical text can score differently.
The fusion model combines the four VLM rubric scores and the four OCR scores into eight features and trains a CatBoost classifier on the same expert labels. Table 1 compares it with models trained on each feature set alone, using the same 20 percent holdout set.
On the same 20 percent holdout set, the CatBoost model using only OCR features achieved 0.82 accuracy and a 0.83 F1 score, while the model using only VLM features achieved 0.89 and 0.90. The fused OCR-VLM-CatBoost model outperformed both standalone models, reaching 0.94 accuracy and a 0.95 F1 score. The 0.05 improvement in both metrics over the VLM-only model demonstrates that OCR isn’t a replacement signal. It complements the VLM’s holistic judgment with fine-grained text-readability information.
| Configuration | Accuracy | F1 Score |
| Baseline (averaged VLM scores + threshold) | 0.80 | 0.84 |
| OCR-only CatBoost | 0.82 | 0.83 |
| VLM-only CatBoost | 0.89 | 0.90 |
| Fused OCR-VLM CatBoost | 0.94 | 0.95 |
Explainable VLM content evaluation with SHAP
A quality label alone doesn’t tell selling partners what to fix first. To find which dimensions drove each decision, we use SHapley Additive exPlanations (SHAP), which assigns each feature a value showing how far it pushed a prediction toward high or low quality. Because the VLM and OCR scores feed the same classifier, SHAP measures both on a common scale. Raw scores can’t do this: a Visual Storytelling score of 6 and a high Character Density don’t tell you which one mattered more to the decision.
Across the holdout set, the most influential features were OCR Character Density (mean absolute SHAP value 1.1), OCR Overall Readability (1.0), and VLM Visual Storytelling (1.0). They were followed by A+ Layout (0.8), Feature Presentation (0.6), and Conversion Optimization (0.4). Both OCR and VLM features rank near the top, so the classifier depends on both sources.
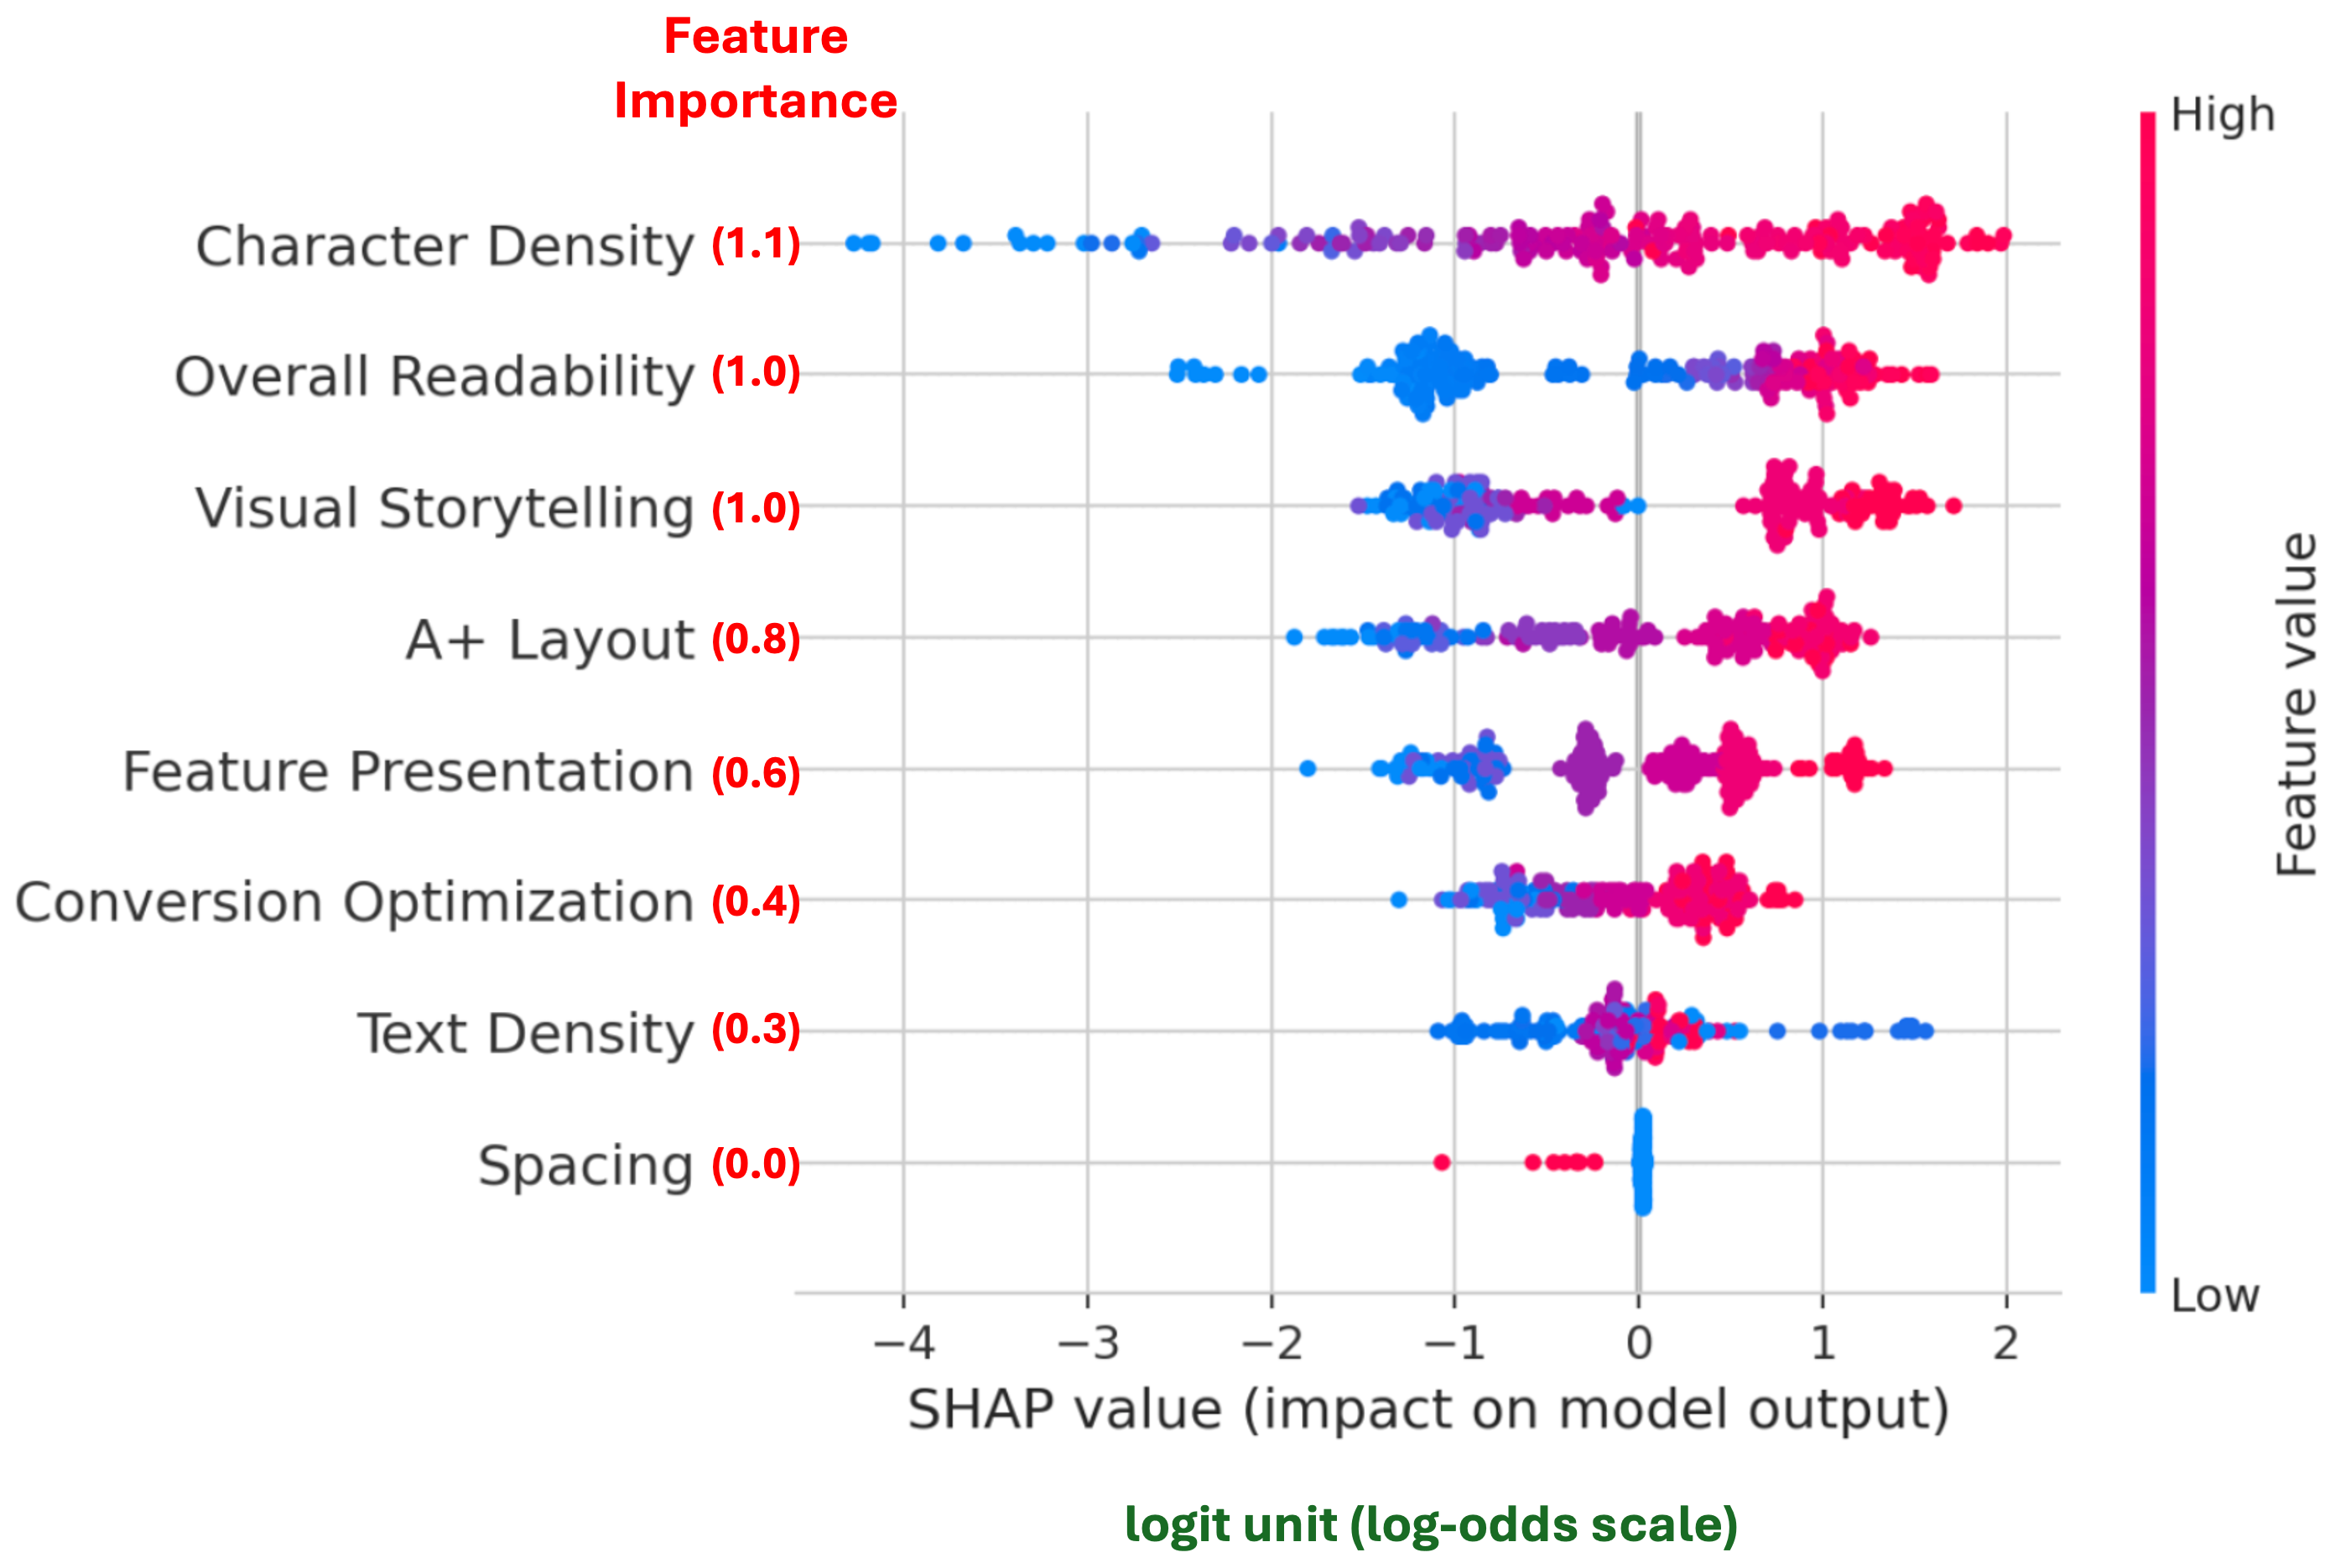
Figure 3: Global SHAP value distributions for all VLM and OCR features
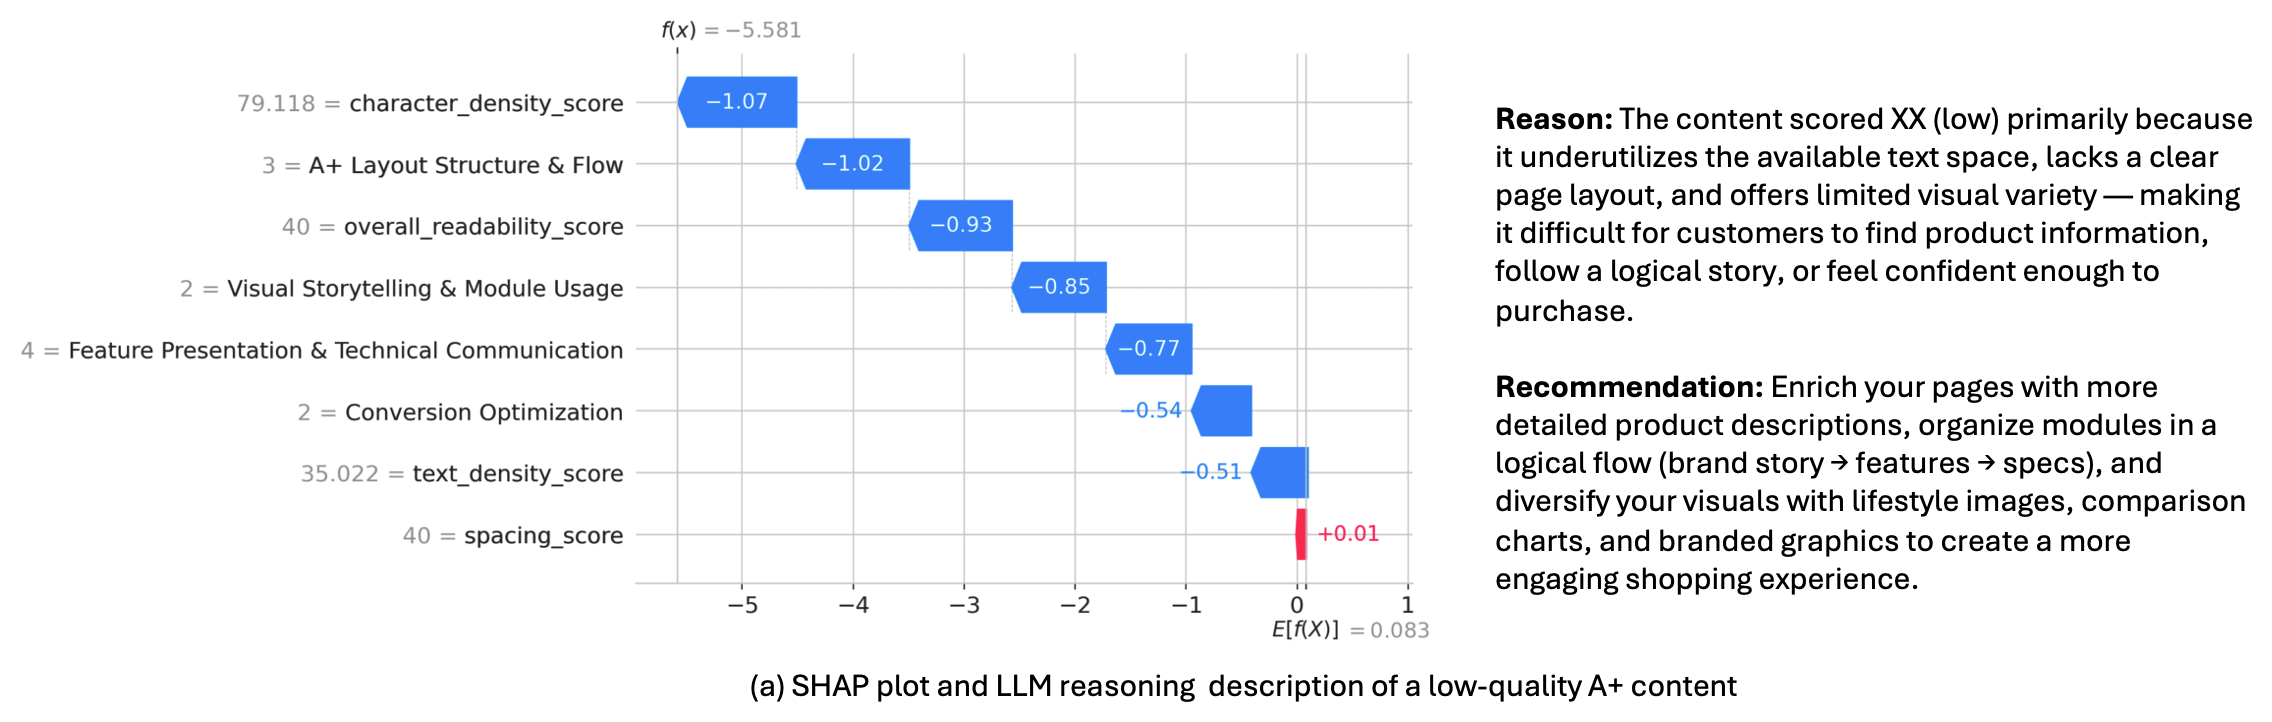
For an individual page, SHAP shows which features lowered the decision. For each page classified as low quality, we rank the eight features by SHAP value, then pass the most negative features, the product category, and ecommerce best practices, along with the VLM’s rationales, to an LLM, which turns them into prioritized, specific actions.
Figure 4 shows two local SHAP plots with the LLM reasoning grounded in the SHAP results, for a low-quality and a high-quality A+ Content sample. For example, if A+ Layout has a SHAP value of -1.2 and Visual Storytelling has -0.3, the system prioritizes restructuring the layout and rebalancing text and images, followed by improvements to the imagery.
 |
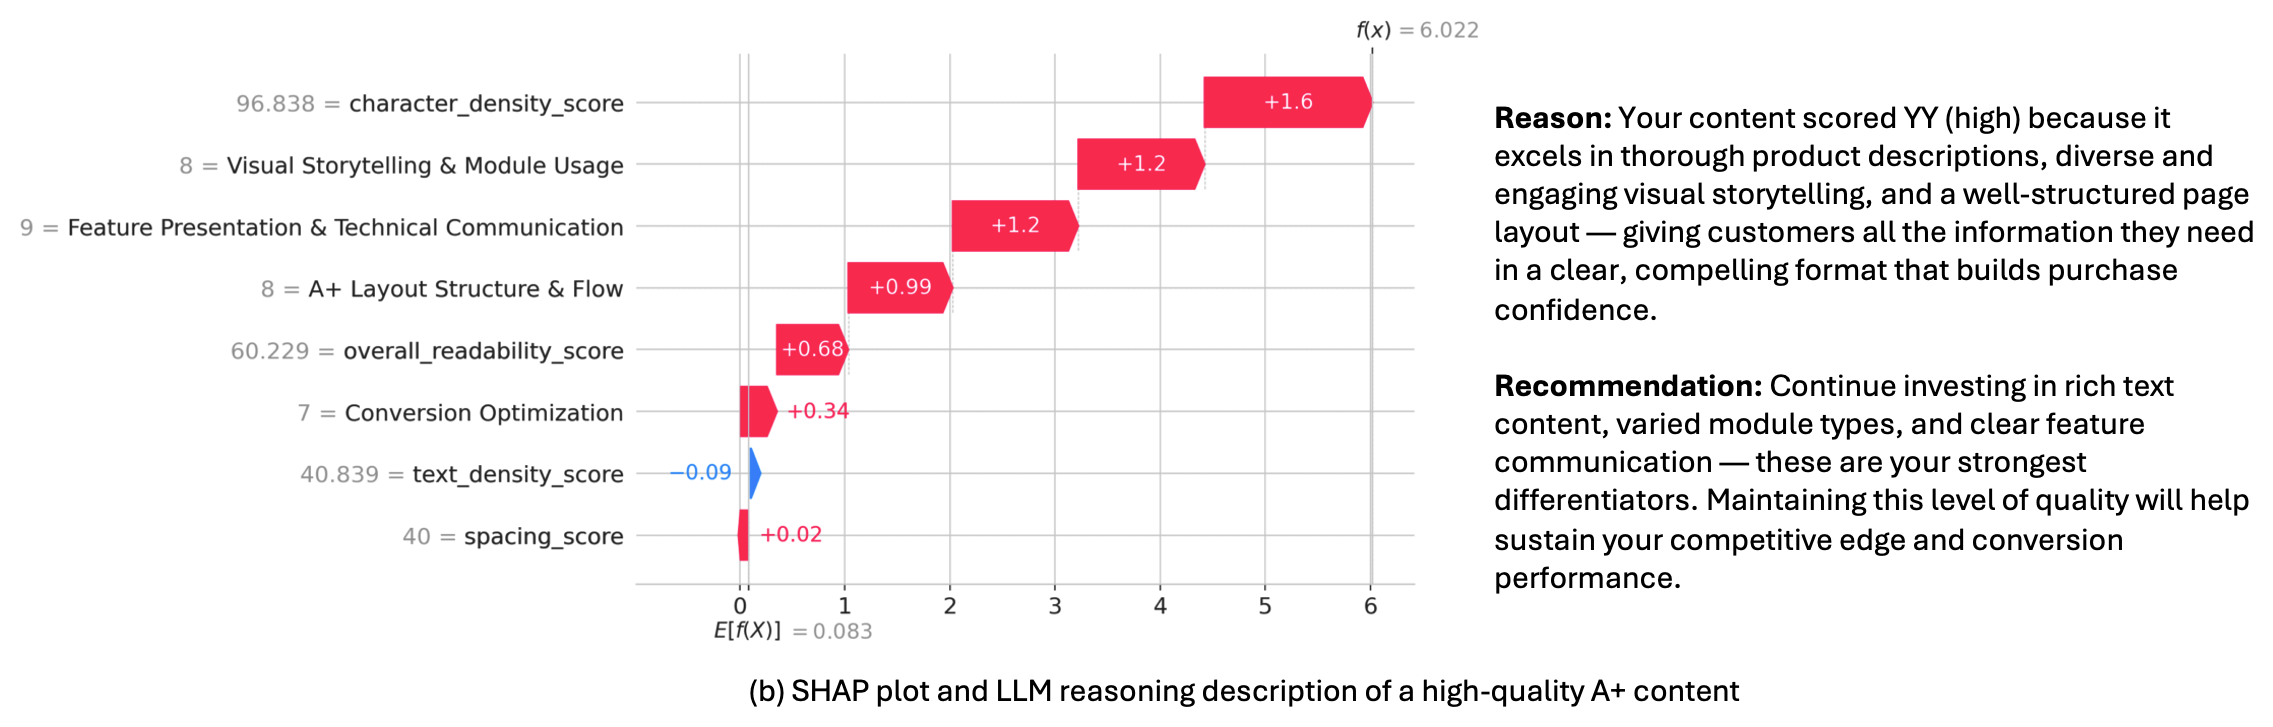 |
Figure 4: Two local SHAP value distributions for all VLM and OCR features: (a) a low-quality case, where most features contribute negatively and drive an improvement-requested recommendation; (b) a high-quality case, where most features contribute positively
We validated the effectiveness of these explanation-based recommendations by measuring quality scores after selling partners revised their content. The average post-revision quality score increased by 1.4 points on a 10-point scale on a statistically significant sample. SHAP contributions can therefore be translated from decision explanations into actionable improvement priorities and methods. Explainability is therefore not merely an auxiliary capability for understanding the model. It functions as a feedback mechanism that materially improves content quality.
Results
The complete system scores each page snapshot with the VLM and OCR, combines the four VLM scores and four OCR scores into a single feature vector, and passes it to a CatBoost classifier trained on expert labels. SHAP then identifies which features drove each decision. To measure what each component adds, we compared four configurations on the same 20 percent holdout set. The holdout set comes from 5,478 product detail pages across 10 product categories, including Furniture, Shoes, Grocery, Beauty, and Apparel.
The baseline averages the four VLM scores and applies a fixed threshold, so every dimension counts equally. It reached 0.80 accuracy and an F1 score of 0.84. Training a CatBoost classifier on the same scores lets the model learn which dimensions matter most and how they interact, which raised accuracy to 0.89 and F1 to 0.90. A classifier trained on the OCR scores alone reached 0.82 accuracy and an F1 score of 0.83. Combining the VLM and OCR scores gave the best results, with 0.94 accuracy and an F1 score of 0.95. That’s 14 percentage points higher accuracy and 11 points higher F1 than the baseline.
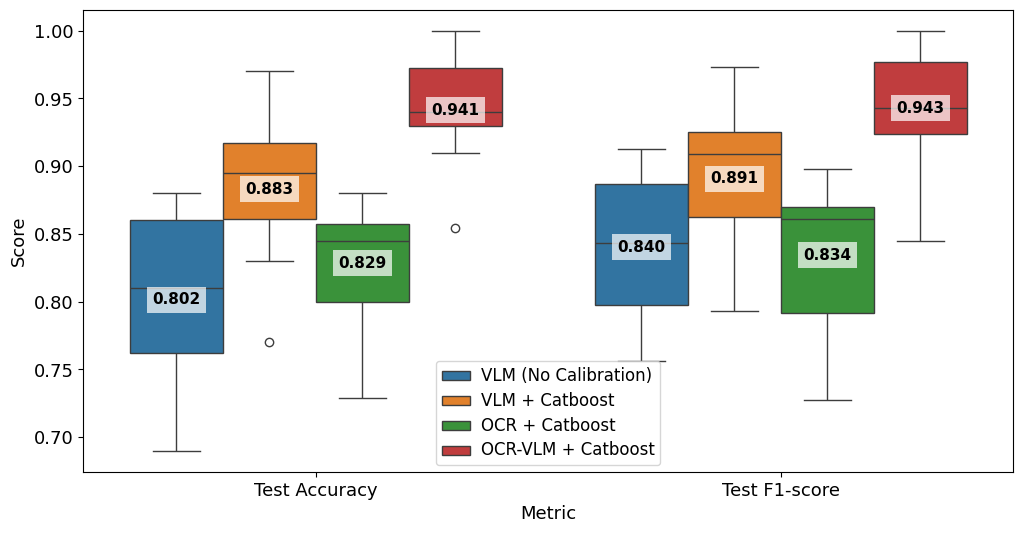
Figure 5: Accuracy and F1 comparison across VLM and OCR evaluation configurations
Examining each performance gain separately makes the value of the integrated approach clearer. CatBoost calibration first reduces the limitations of a fixed threshold by learning dimension-specific weights and nonlinear decision boundaries. Adding OCR features then supplies text-readability signals that the VLM can miss. Overall, the final fusion model improves accuracy by 0.14 and F1 by 0.11 over the baseline.
We also changed the VLM backbone in an additional experiment on a single-category dataset containing 499 content projects. With a lighter VLM variant, the baseline achieved 0.74 accuracy and a 0.72 F1 score, while the OCR-VLM-CatBoost model achieved 0.90 for both metrics. With a more capable VLM variant, the baseline achieved 0.79 accuracy and a 0.84 F1 score, while the fusion model achieved 0.94 and 0.95. The fusion approach improved accuracy by 0.16 and 0.15 for the two VLMs, respectively, demonstrating that complementary OCR features deliver consistent gains without depending on a particular foundation model.
To reduce development costs while retaining access to high-performance foundation models, the system freezes the VLM and