View as Markdown View this page as plain text
Connect to Cursor Install MCP Server on Cursor
Connect to VS Code Install MCP Server on VS Code
An Open Field Guide to Inference Engineering
This guide is for platform engineers new to inference. If you need to understand how models and GPUs work together and how to run inference in production, this guide will help. You’ll also learn about the tools to use and how to grow into an inference engineering role.
This guide builds on the work of others in the inference community. If you’re interested in inference engineering, continue your learning with these:
Viktor Farcic’s LLM Inference Explained
Philip Kiely’s Inference Engineering
The Pragmatic Engineer, What Is Inference Engineering?
ByteByteGo’s Guide to AI Inference Engineering
Data Gravity on The Rise of Inference Engineering
Spheron’s Inference Engineering Guide
Vishakha Sadhwani’s The AI Inference Engineering Roadmap
Upbound, Project Champagne series
1. Why now?
In an AI-forward organization, platform teams become inference teams. Coding assistants can’t send source code to third parties, and frontier model bills increase month to month. Support tools also need internal data that a hosted model can’t reach.
Organizations want to run these models themselves, and open models now make that practical.
Hugging Face hosts more than two million open models, and the best of them compete with closed models. DeepSeek released R1 in January 2025, and it matched OpenAI’s o1 on math and coding benchmarks about a month after o1 came out . When you run your own model, you control latency, uptime, and where your data goes. At high volume, you can also cut costs by about 80% .
The work suits platform engineers. The price of a fixed level of AI capability falls roughly 10x a year, and most of that comes from how models are served, not from better GPUs . Upbound, the company behind Crossplane and Modelplane, saw this firsthand. In its Project Champagne blog series, the team ran its own models on Modelplane and found that vLLM and scheduling worked. The time went to TLS, identity, timeouts, storage, IAM and observability.
Skills that carry over
An inference engineer picks a model, gets it onto the right GPU, keeps it serving, makes it faster and cheaper, and gets paged when it breaks. That’s SRE for a new workload, and most of your skills carry over:
A hosted API is still the right call early in a product’s life . Self-hosting pays off when API spend becomes a real line item, when latency or reliability needs outgrow vendors, or when data can’t leave your network. In August 2026, Chris Zeoli counted about 58 open inference roles on public careers boards, with no settled job title.
2. Inference 101
This section covers the concepts in roughly the order you’ll meet them. Most are about what the engine keeps in GPU memory or what limits its speed.
Viktor Farcic suggests asking when each concept starts to matter. Some matter as soon as you deploy, others only once many people use the model, and some you may never need. The table near the end of this section gives the signal for each.
What an inference engine is
An inference engine, like vLLM or SGLang , is the server that turns model weights into an API. For a platform engineer, the closest mental model is a stateful database server with a GPU attached. It loads a large dataset into memory at startup and keeps per-session state. It also schedules work internally and answers over HTTP. Ollama on a laptop is the same idea at small scale, and every hosted model API runs one behind the scenes.
Unlike a database, the engine keeps its working set in GPU memory, not RAM. GPU memory is small and expensive, so most tuning is about deciding how much of it each request gets.
The inference stack
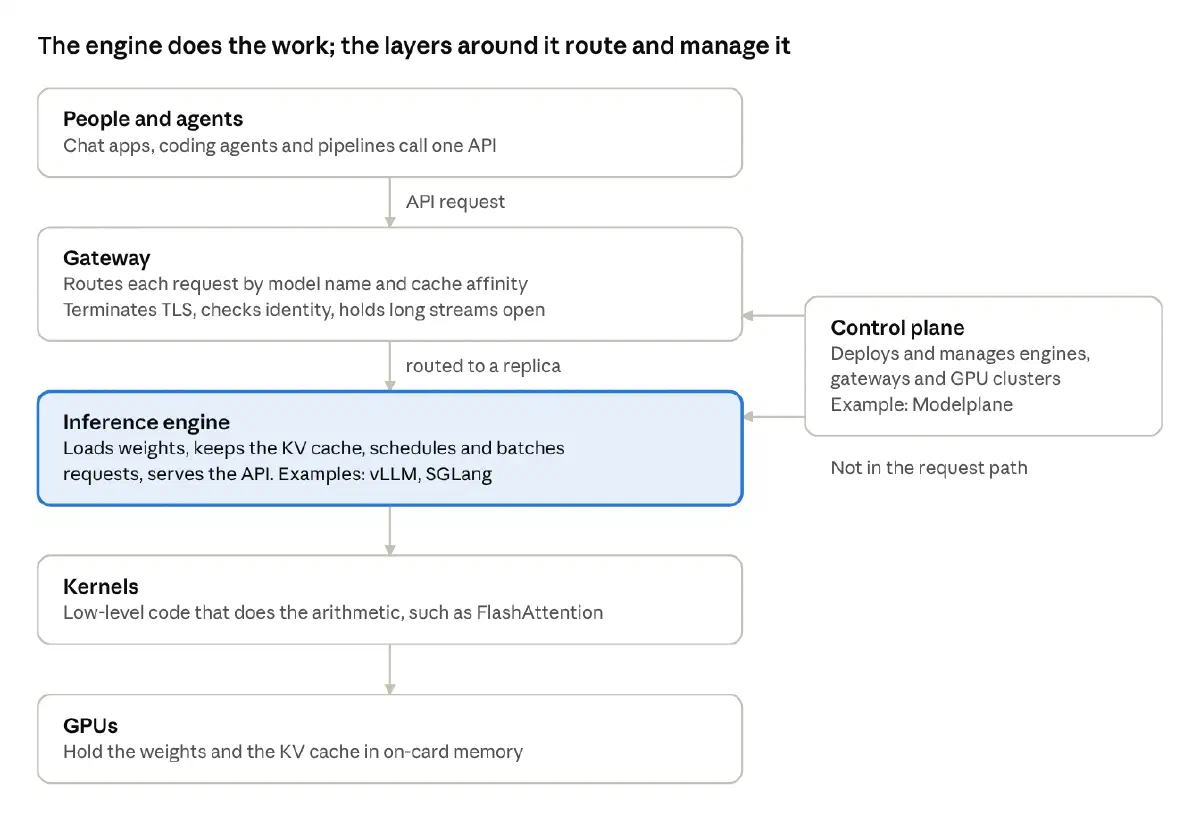
The engine is one layer of four. At the bottom, kernels do the arithmetic. You rarely choose them directly. Above them sits the engine . Above that, a control plane deploys and manages engines, because sooner or later you run more than one. On top, a gateway routes traffic across models and replicas.
Inference stack: four layers and the clients they serve
Requests pass through the gateway to an engine, which runs kernels on the GPU. The control plane deploys and manages the gateway and engines, but no request passes through it.
Tokens
A token is the unit a language model works in, roughly a word or word fragment. Context windows, prices and speeds are all counted in tokens. When someone quotes tokens per second, they mean this unit.
Weights and the KV cache
The weights are fixed, and the KV cache grows with load. Size for both, as you would a database’s footprint and working set.
Weights are the fixed footprint. Most models are released at 2 bytes per parameter (BF16 or FP16), so an 8B model needs about 16 GB, and it has to live in GPU memory, not system RAM. On a 48 GB L40S, that leaves about two-thirds of the card for everything else. That number is the same for one user or a hundred.
The KV cache is the working set. Each new token is computed against every token before it. Rather than recompute that history, the engine keeps the attention keys and values for every token in flight. Its size scales with context length multiplied by the number of concurrent conversations, much like a session store that grows with both session size and user count.
You can estimate the KV cache per token from a model’s config:
KV bytes per token = 2 × layers × KV heads × head dimension × bytes per value
For Llama 3 70B at FP16 (80 layers, 8 KV heads, head dimension 128), that is about 320 KB per token. One 128K-token conversation needs about 40 GB of cache. At that size, the KV cache usually limits how many users a GPU can serve.
Mixture-of-experts (MoE) models keep every weight resident. A model with 320B total parameters and 18B active still needs about 320 GB at FP8. Only compute scales with the active parameters.
Read the checkpoint size, not the dtype table. While self-hosting its own models for Project Champagne , Upbound estimated one MoE model at about 315 GB from its dtypes (Part 2). The real checkpoint was 177.7 GB, because the experts were stored in a 4-bit format.
Leave room for runtime overhead. CUDA graphs, activations and memory fragmentation all take space. A model that fits at startup can still run out of memory days later ( Project Champagne, Part 2 ).
Two phases, two bottlenecks
Each request runs in two phases on the same GPU, and they are limited by different things .
Generating one token does one or two floating-point operations per byte read from memory, depending on weight precision. An H100 needs about 295 operations per byte to stay busy. That means one request uses a small fraction of the chip while the compute units wait on memory ( Data Gravity ).
Peak compute has grown about 3x every two years, against about 1.6x for memory bandwidth. Nearly every optimization either moves fewer bytes per token or spreads each byte across more tokens.
Because the phases have opposite bottlenecks, a technique that speeds one often does little for the other. That is why benchmarks report TTFT and tokens per second separately.
Metrics to track
Cost per million tokens converts a GPU price and a throughput into one comparable number:
Cost per million tokens = GPU cost per hour / (tokens per second × 3600) × 1,000,000
Spheron’s worked example: a GPU at $2.90 an hour sustaining 1,200 tokens per second costs about $0.67 per million tokens.
Latency versus throughput
Batching more requests together raises total throughput and slows each individual user. Interactive chat and coding favor latency. Overnight batch jobs favor throughput.
It’s the same trade-off as tuning a database for transactions or for analytics. Write down the workload’s constraints before you tune anything.
When to adopt each concept
Each row gives the symptom that tells you it’s time to act, in roughly the order teams need them.
Most teams need only the first few rows on day one. Add the rest when their signals show up.
What agents change
Coding agents and other agentic workloads stress every part of this picture. Upbound measured this in Part 5 of its Project Champagne series (introduced in Section 1), where about 10 of its engineers ran Claude Code and other coding agents against a self-hosted model. Their traffic looked like this:
Prompts are long. The median prompt was 59K tokens and the p90 was 125K.
Prompts are mostly repeated. About two-thirds of prompt tokens hit the prefix cache, because agents resend their transcript on every turn.
Thinking is hidden. A reasoning model can think for more than a minute before its first visible token. Every timeout between the agent and the model has to allow for that.
Load depends on the client. Short-prompt sessions launch subagents and can keep more requests in flight than long-prompt sessions. Plan capacity in requests in flight rather than seats.
Sessions run for hours. Streams, tool calls and credentials all have to keep working for that long.
3. Running inference in production
In production, every choice trades latency, throughput, cost and quality against each other, usually with too few GPUs. Where a practice comes from Project Champagne, Section 5 has the details.
3.1 Start from use cases, not hardware
Each use case sets different requirements. In Project Champagne:
Coding agents needed long context without quality loss, reliable tool-call parsing, streaming, sessions that last hours, and an Anthropic-compatible API for Claude Code.
Chat needed low time to first token, real concurrency, and an OpenAI-compatible API for existing tools.
The platform needed TLS on a real hostname and identity tied to the company domain. It also needed observability that tells a healthy engine from a busy one, and correct placement without babysitting.
Separate interactive workloads from batch workloads. They need different targets, and often different deployments. Write the pass and fail bar down before you test anything.
3.2 Pick models deliberately
Evaluate on your own tasks. Public benchmarks measure someone else’s workload. Section 3.11 covers how.
Start small, then grow. A small MoE model with a few billion active parameters builds operating experience faster and costs less to get wrong.
The newest model is not always the right one. Model releases move faster than hardware plans. A new ‘small’ flagship can need several of the largest cards, while your current model may be running at half its supported context. The cheapest gain may not need a new model at all.
Check that your engine can actually load it. A model listed as supported in release notes may still fail to load on your hardware and engine build.
Check the license. Most open models use permissive licenses, but some restrict commercial use.
Check the chat template and parsers. Tool calls and reasoning output depend on settings each model needs in the engine. A wrong one breaks tool use while every request still returns 200.
3.3 Size for runtime, not startup
A model that fits at startup can still run out of memory under real traffic when fragmentation pushes past the profiled peak. That can happen days later, in the middle of a request.
Budget all three costs: weights, KV cache, and runtime overhead such as CUDA graphs and activations.
Know what your engine’s memory setting covers, and check again on every upgrade. vLLM sizes its KV cache from a startup estimate of everything else, including CUDA graph pools, and real traffic can go past that estimate. If you see out-of-memory errors under load, lower the memory fraction slightly, enable expandable segments and cap concurrent sequences, then measure free memory again.
Cap every request. Set a maximum output length on every call. Without one, any request can take a model down for everyone, and abandoned requests keep generating after the client gives up.
Shorten context with care. A shorter maximum context frees KV cache for more users. It also rejects every longer conversation, so count those rejections as errors.
3.4 Know the optimization techniques
Most engines turn on continuous batching and paged KV cache by default. The rest are choices you make per model and workload.
Structure prompts for the cache. Prefix caching stops at the first token that differs. Put shared content such as system prompts and tool definitions first, and variable user input last. Hosted APIs price cached input at 10 to 50% of fresh input, as of 2026, for the same reason ).
Quantize from least to most sensitive. Linear weights tolerate quantization best, then activations, then the KV cache. Attention layers are the most sensitive, because small errors compound across a long sequence. Keep the most sensitive parts at higher precision until your evals show you can go lower. Floating-point formats such as FP8 handle outlier values better than integer formats.
Watch speculative decoding acceptance. Acceptance depends on temperature, subject matter and the draft model. If acceptance collapses, every pass still pays for the guesses and the model slows while other panels look normal.
Beware interactions when applying multiple techniques. Quantizing the KV cache helps disaggregation. Larger batches leave less spare compute for speculation. One Baseten engineer tried 77 configurations before finding one that doubled throughput for a customer (Inference Engineering). Change one thing at a time and measure (Section 3.10).
Keep long prompts from stalling other streams. Chunked prefill splits a long prompt across several passes, so decode keeps moving for everyone else. Current vLLM turns it on by default, and its token budget per pass is the setting to tune before you consider disaggregation.
3.5 Get GPUs, and place them correctly
Quota doesn’t guarantee capacity. Quota only lets you request instances. Each instance size is its own capacity pool, even with the same GPU, and no cloud API tells you what you can actually launch.
Design for whatever GPUs you can get. Expect to get the GPU you planned for only some of the time. A model may end up split across smaller nodes in different zones, using pipeline parallelism over ordinary networking. Allow multi-zone pools, and keep the model definition independent of the instance type and node count.
Match models to hardware explicitly. Kubernetes Dynamic Resource Allocation (DRA) device selectors can pin a model to a GPU architecture or a minimum memory size. Verify placement against what the GPU driver publishes, not against a status field that echoes what you declared.
Watch the cloud, not just the controller. A managed node group can report failure while the cloud keeps trying to launch instances, and GPUs that arrive hours later can be shut down by a later change to the pool. Track instances and node joins, and list a pool’s instances before you change it.
Know your interconnect. SXM datacenter GPUs such as H100, H200 and B200 link GPUs with NVLink. PCIe cards such as the L40S and RTX PRO 6000 do not, so multi-GPU communication goes over PCIe and host memory. That changes which parallelism strategies pay off.
Size the system pool too. GPU nodes are tainted for inference. Monitoring, controllers and gateways compete for whatever general capacity is left.
3.6 Gateways, routing and timeouts
Do not round-robin. One replica may already have a conversation’s prefix in cache while another has never seen it. Use cache-aware or prefix-aware routing, such as the endpoint picker in the Gateway API Inference Extension .
Route by model name. One hostname can serve many models, routed on the request’s model field.
Speak both common APIs. Most tools expect the OpenAI API. Claude Code expects the Anthropic Messages API, which vLLM serves natively, including streaming and tool calls.
Raise every timeout on the path. Long generations and reasoning models break the defaults, because each hop has a default timeout sized for web requests, not for generations that run for minutes. Typical culprits are a gateway route timeout that bounds the whole response, a load balancer idle timeout, and retries that multiply the wait. Check the route, each load balancer, the gateway, the client and any helper calls the client makes.
Detect truncated streams. A cut stream can return HTTP 200 with valid tokens and then stop. To the client, it looks like a finished answer.
Meter usage per caller. Token-based rate limits and quotas at the gateway keep one heavy user or runaway agent from starving everyone else.
3.7 Security and identity
Never expose an open endpoint. Apply your auth policy before the gateway gets an address, and remove it last when you tear down.
Use real TLS on a real hostname, with a plan for certificate issuance and renewal.
Plan for three kinds of client. People are the simplest case. Browsers cannot attach a bearer token to page loads or preflight requests, so handle browser login with OIDC at the gateway. Agents run for hours and read their credential once, so a 60-minute identity token will end them mid-session. Give agents long-lived API keys or a credential that refreshes.
Do not stack two expiring sessions. An outer gateway login in front of an app with its own login causes an outage when the outer session expires.
Test what should be refused. Build a probe matrix of requests the gateway must reject, such as a missing, garbage, unsigned, expired or revoked key, or a forged caller header. Include paths that must remain reachable, such as the health check. Run it on a schedule and in a loop during changes.
Carry identity into usage records, so you can see who sends what. Overwrite any caller header a client tries to forge.
Treat model weights like code. Prefer safetensors over pickle-based checkpoints, don’t enable remote code from a model repo you haven’t read, and pin each model to a specific revision.
3.8 Observability
Scrape the engines. Engines expose detailed Prometheus metrics. Nothing collects them unless something is set up to scrape them, such as a ServiceMonitor and a named port.
Build the core panels: requests running against the concurrency limit, requests waiting, KV cache use, TTFT, time per output token, output tokens per request, prefix cache hit rate, speculative decoding acceptance, errors by status code, and cancellations.
Measure quality on the server. Broken tool calls, cut-off answers and empty responses usually reach you as user complaints while the serving dashboards look normal. Count them on the server instead, including tool calls that fail to parse, responses cut off by the length limit, empty outputs, refusals and hidden reasoning tokens per request. The gateway sees every response, so it can count anything the engine doesn’t export.
Look past GPU-Util . It reports whether anything ran, not how much of the chip worked. A GPU can report near 100% GPU-Util while SM activity is around half and tensor cores sit mostly idle. Graph SM activity and tensor activity as well.
Tell the kinds of sl