Foundation models deployed on Amazon SageMaker HyperPod meet inputs that no pre-curated dataset covers: domain-specific jargon, unexpected formats, new products, and changing user behavior. Without a record of production inference data, teams can’t detect drift, find failure patterns, or use real interactions to improve the model.
Amazon SageMaker HyperPod now provides Data Capture, a built-in capability that records live inference inputs and outputs to Amazon Simple Storage Service (Amazon S3) at three independent tiers, with minimal latency impact and zero impact on model availability.
In this post, we walk through one complete example on a single SageMaker HyperPod cluster. A home-appliance support router captures its production traffic, Amazon Athena queries surface a new-product blind spot, a SQL policy labels the captured records, and a fine-tune on that data teaches the router the new product. We measure accuracy before and after, on data that could not have existed before the model was deployed. The inference operator serves the model on one node, and the training operator runs the fine-tuning on another.
We use synthetic data for the walkthrough. The scripts, manifests, SQL, synthetic datasets, and expected outputs are available in the accompanying GitHub repository.
Three-tier Data Capture architecture
HyperPod Data Capture provides three independent tiers, each at a different point in the request path. You can turn on any combination in the same dataCapture block.
| Tier 1: SageMaker endpoint | Tier 2: Load balancer | Tier 3: Model pod | |
| What’s captured | Full request/response payloads | Application Load Balancer (ALB) access-log fields: request line, status codes, timings, client IP, user agent | Full request/response payloads plus event metadata |
| Managed by | SageMaker native data capture | ALB access logs | HyperPod inference operator (NGINX + OTel collector + S3 uploader sidecars) |
| Best for | Compliance, Model Monitor, audit | Traffic and error-rate monitoring at low cost | Debugging, analytics, training-data collection |
| Configuration | sagemakerEndpoint: — sampling %, input/output, AWS KMS |
loadBalancer: { enabled: true } |
modelPod: — sampling %, input/output, buffer, max payload size, AWS KMS, content types |
Tiers 1 and 3 both store full payloads, so enabling both stores every record twice. Use Tier 1 for compliance and Model Monitor, Tier 2 when you only need traffic metadata, and Tier 3 when you intend to use the payloads. This post uses Tier 3 only. Because Tier 3 records complete payloads, which can include names, addresses, and order numbers, protect that data before it becomes training data. Use sampling, AWS Key Management Service (AWS KMS) encryption (kmsKeyId), S3 lifecycle rules, and personally identifiable information (PII) redaction (for example, with Amazon Comprehend).
Prerequisites
- A SageMaker HyperPod cluster orchestrated by Amazon Elastic Kubernetes Service (Amazon EKS), with the inference operator installed (Setting up your HyperPod clusters for model deployment) and the training operator EKS add-on
amazon-sagemaker-hyperpod-training-operatorinstalled (Installing the training operator). - Two available NVIDIA GPUs, one for serving and one for training. We used an
ml.g6e.8xlargefor serving and anml.g6e.xlargefor training (one 48 GB NVIDIA L40S each). The serving pod holds its GPU for the life of the endpoint, so with only one GPU the training pod staysPending. kubectlconfigured for the cluster.- An S3 bucket in the same Region.
Confirm both operators are installed. The command returns two rows:
kubectl get crd | grep -E 'inferenceendpointconfigs|hyperpodpytorchjobs'
hyperpodpytorchjobs.sagemaker.amazonaws.com                         2026-09-21T10:57:14Z
inferenceendpointconfigs.inference.sagemaker.aws.amazon.com         2026-08-06T11:58:53Z
Solution overview
The following diagram shows the five steps of the walkthrough on one SageMaker HyperPod cluster: capture every request and response to Amazon S3, analyze the captures with Athena, label them with a SQL policy, fine-tune with the training operator on a second GPU, and redeploy side by side with capture still on.
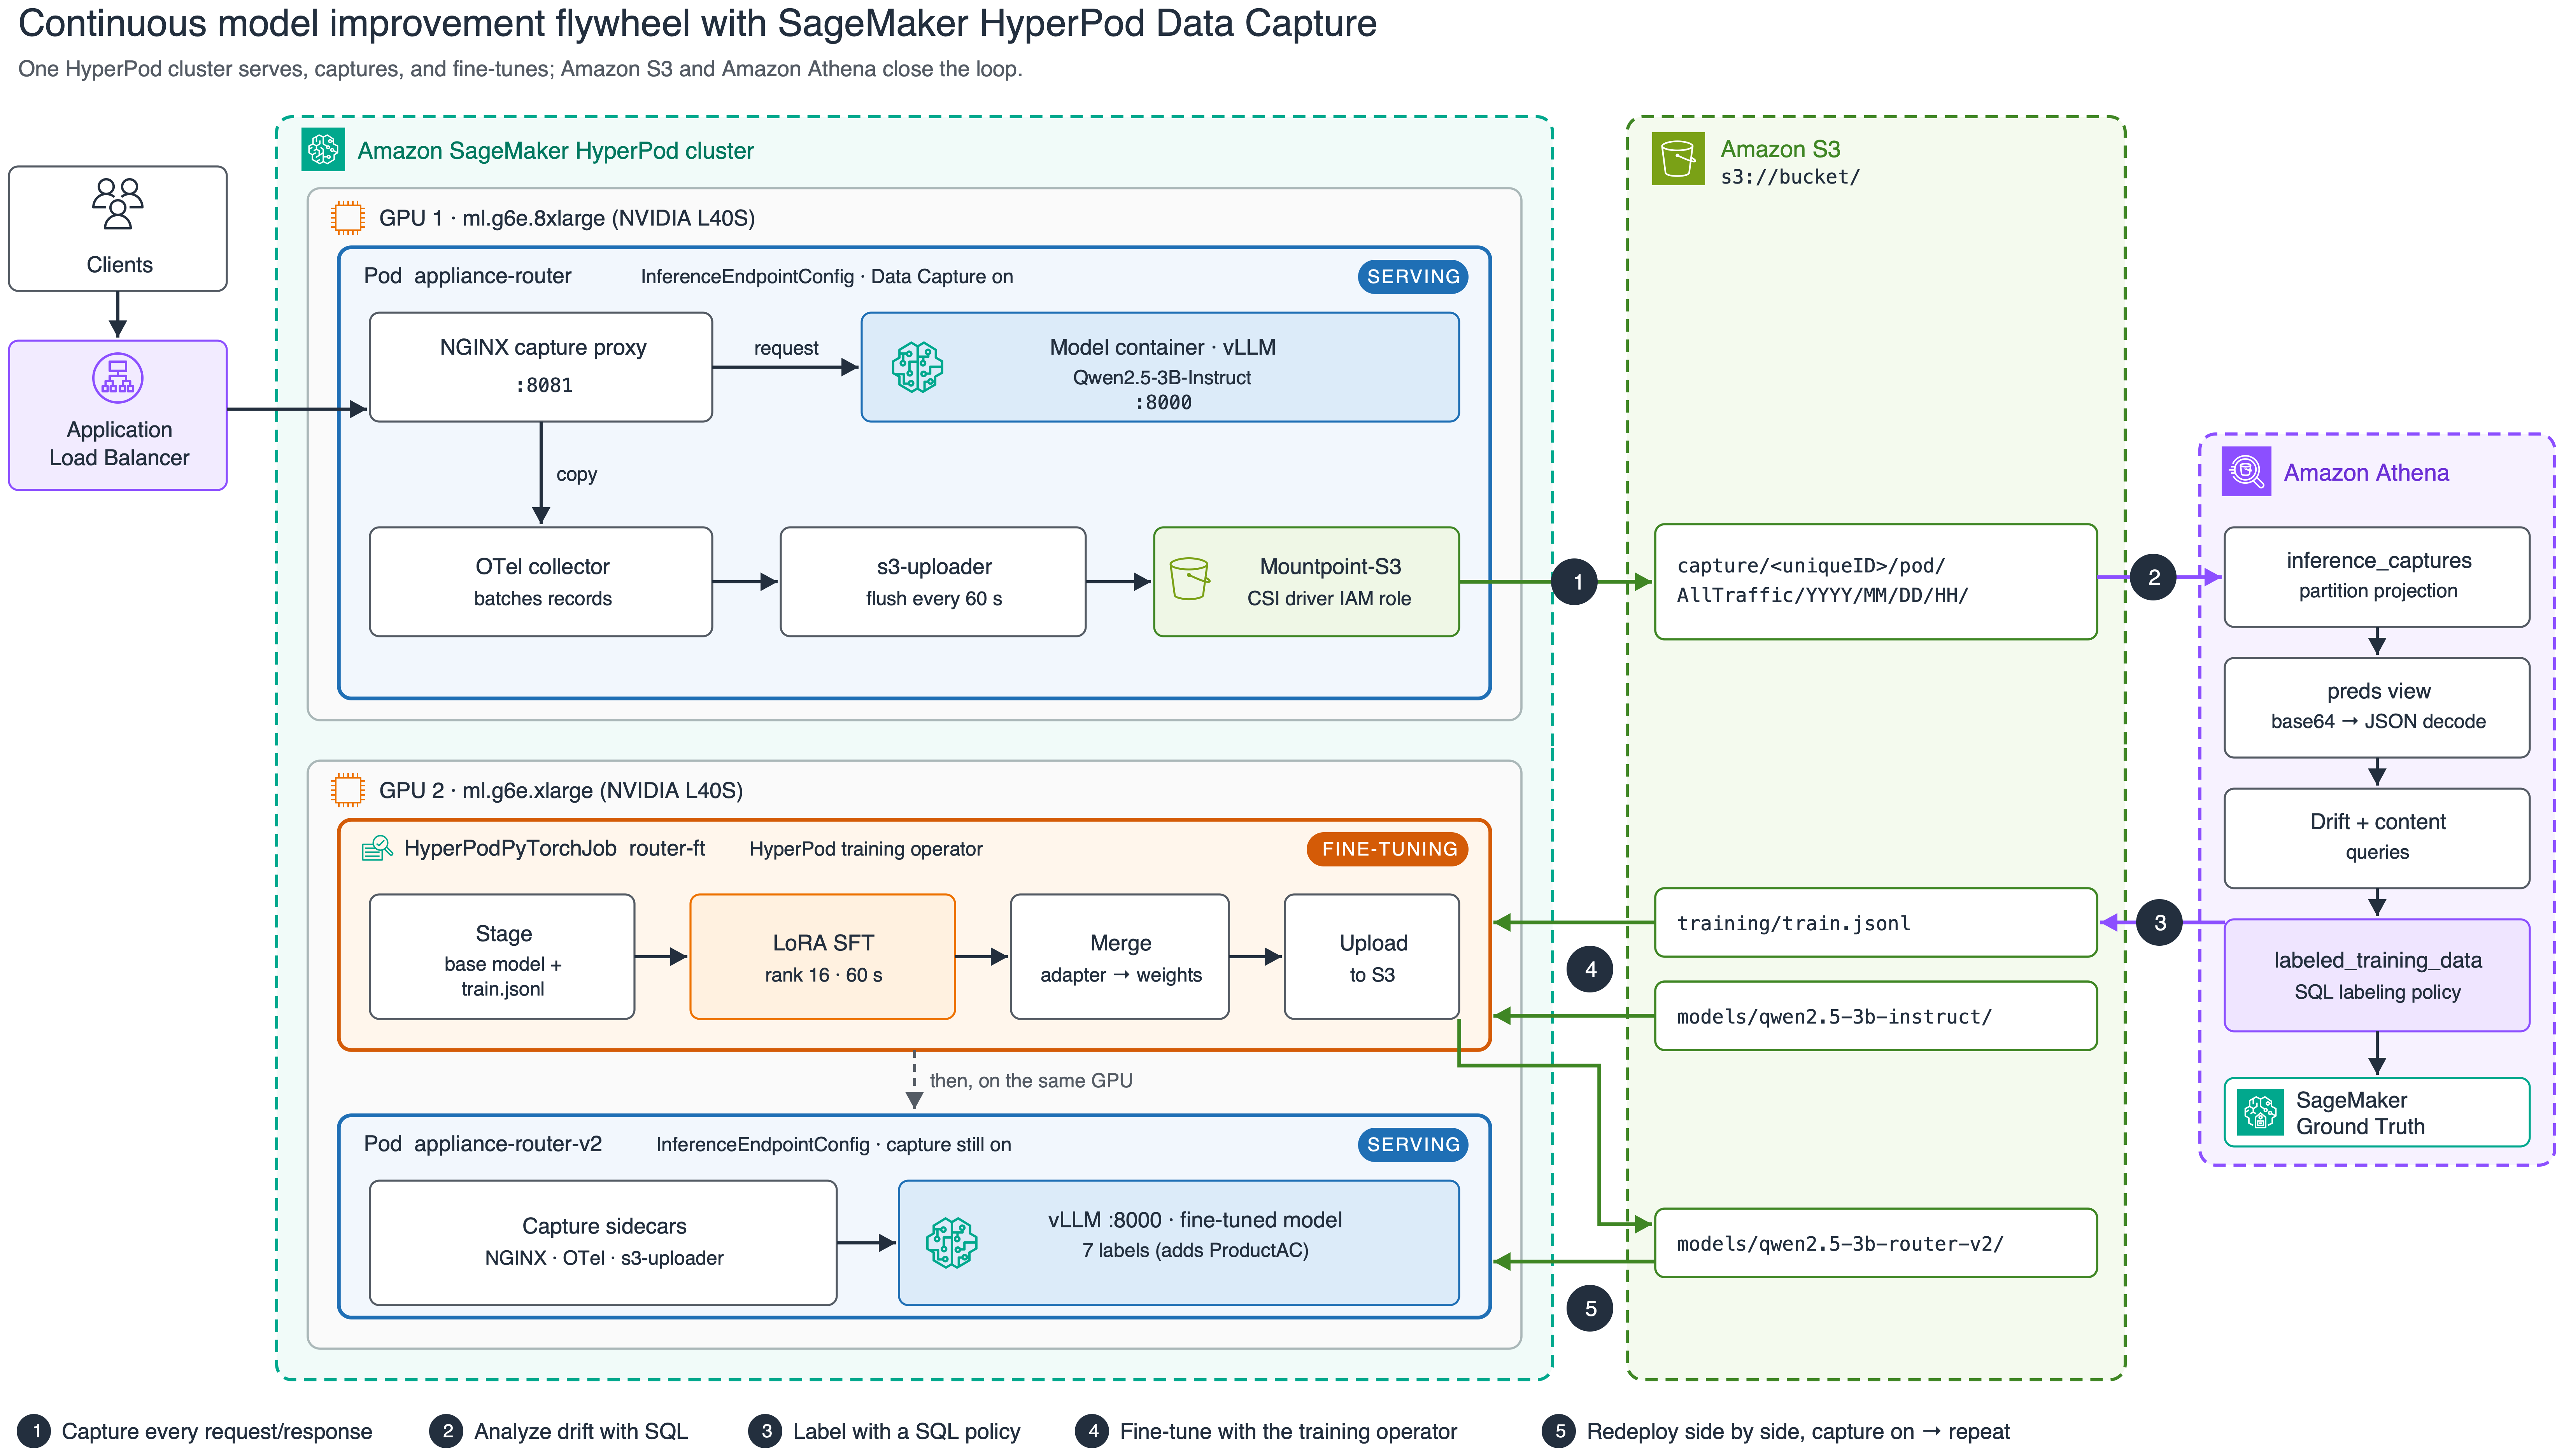
Figure 1: The five-step flywheel on a single SageMaker HyperPod cluster, from capture through Athena analysis, labeling, fine-tuning, and redeploy
The inference operator adds three sidecars to the model pod. Every request that passes through the NGINX proxy is copied to an OpenTelemetry collector, batched, and written to S3 through a Mountpoint-S3 volume. Athena reads those files in place. The training operator runs the fine-tune as a HyperPodPyTorchJob on a second GPU, and the new model is served by a second endpoint that also has capture on.
Step 0: Set your variables
Every later step reads these. Edit the first block, then paste the whole thing:
# --- edit these ---
export EKS_CLUSTER_NAME="my-hyperpod-eks"
export AWS_REGION="us-east-1"
export BUCKET="amzn-s3-demo-bucket"
export SERVE_INSTANCE_TYPE="ml.g6e.8xlarge"     # node type for the first endpoint
export TRAIN_INSTANCE_TYPE="ml.g6e.xlarge"      # node type for the fine-tuning job
# --- leave as-is ---
export AWS_DEFAULT_REGION="$AWS_REGION"
export ENDPOINT_NAME="appliance-router"
export MODEL_LOCATION="models/qwen2.5-3b-instruct"
export MODEL_V2_LOCATION="models/qwen2.5-3b-router-v2"
export TRAIN_SA="flywheel"                     # service account with S3 access via EKS Pod Identity
aws eks update-kubeconfig --name "$EKS_CLUSTER_NAME" --region "$AWS_REGION"
render() { python3 -c 'import os,sys; sys.stdout.write(os.path.expandvars(sys.stdin.read()))'; }
Step 1: Stage the base model in S3
We use Qwen2.5-3B-Instruct because it is small enough to fine-tune in about a minute and fits on a single L40S.
pip install -q huggingface_hub
python3 -c "from huggingface_hub import snapshot_download; \
  snapshot_download('Qwen/Qwen2.5-3B-Instruct', local_dir='qwen2.5-3b-instruct')"
aws s3 sync qwen2.5-3b-instruct "s3://${BUCKET}/${MODEL_LOCATION}/" --exclude ".cache/*"
Step 2: IAM permissions
Four identities need access. For the policy statements, see Data capture for inference on HyperPod.
- The Mountpoint-S3 CSI driver role. Tier 3 capture writes through a Mountpoint-S3 volume, and the driver authenticates as its own IAM roles for service accounts (IRSA) role, not as the pod’s service account. It needs
s3:PutObject,s3:AbortMultipartUpload, ands3:DeleteObjecton your capture bucket, pluskms:Decrypt,kms:GenerateDataKey, andkms:DescribeKeyif you setkmsKeyId. If this is missing, the endpoint stays healthy and requests succeed, but no captures appear. See Mountpoint for Amazon S3 CSI driver. - The inference operator execution role. It needs
s3:PutObjecton your capture bucket, pluskms:Decryptandkms:GenerateDataKeyif you setkmsKeyId. The capture files themselves are written through the CSI driver role, so when no captures appear, check that role first. - The training pod’s service account (
$TRAIN_SA). Read access to the base model and training data, and write access for the merged model, through EKS Pod Identity. - Athena. Read access to the capture prefix, plus a query-results location.
Enabling Data Capture
The next three steps deploy the router with Tier 3 capture on, check that the pod runs the capture sidecars, and confirm that records reach Amazon S3.
Step 3: Deploy the model with Tier 3 capture enabled
This is the whole feature: the dataCapture.modelPod.enabled: true block. Everything else is an ordinary vLLM deployment.
cat > endpoint.yaml <<'YAML'
apiVersion: inference.sagemaker.aws.amazon.com/v1
kind: InferenceEndpointConfig
metadata:
  name: ${ENDPOINT_NAME}
  namespace: default
spec:
  replicas: 1
  modelName: ${ENDPOINT_NAME}
  endpointName: ${ENDPOINT_NAME}
  instanceType: ${SERVE_INSTANCE_TYPE}
  invocationEndpoint: v1/chat/completions
  modelSourceConfig:
    modelSourceType: s3
    modelLocation: ${MODEL_LOCATION}
    s3Storage:
      bucketName: ${BUCKET}
      region: ${AWS_REGION}

  # >>> This is all you need to turn on Tier 3 data capture <<<
  dataCapture:
    s3Uri: "s3://${BUCKET}/capture/"
    modelPod:
      enabled: true
      initialSamplingPercentage: 100
      bufferConfig:
        batchSize: 50
        flushIntervalSeconds: 60
      payloadConfig:
        maxPayloadSizeKB: 1024

  worker:
    image: vllm/vllm-openai:v0.10.0
    modelInvocationPort:
      containerPort: 8000
      name: http
    modelVolumeMount:
      mountPath: /opt/ml/model
      name: model-weights
    args: ["--model", "/opt/ml/model", "--served-model-name", "${ENDPOINT_NAME}",
           "--port", "8000", "--max-model-len", "2048", "--gpu-memory-utilization", "0.90"]
    resources:
      requests: { cpu: "2", memory: 16Gi, nvidia.com/gpu: 1 }
      limits:   { nvidia.com/gpu: 1 }
YAML
render < endpoint.yaml | kubectl apply -f -
The preceding modelPod block sets 100% sampling and captures both input and output, which are the defaults. To tune it, add any of these optional fields under modelPod:
modelPod:
  enabled: true
  initialSamplingPercentage: 50          # capture 50% of requests (default 100)
  bufferConfig:
    batchSize: 100                       # records buffered per upload batch (default 10)
    flushIntervalSeconds: 60             # max seconds before a flush (default 60)
  payloadConfig:
    maxPayloadSizeKB: 1024               # truncate payloads larger than this (default: no limit)
  kmsKeyId: "arn:aws:kms:...:key/..."    # encrypt captures at rest
Step 4: Wait for the pod
A capture-enabled pod runs four containers: the model, sidecar-reverse-proxy (NGINX), otel-collector, and s3-uploader. The model container and the pod’s app label are both named after modelName.
kubectl get pods -l app=$ENDPOINT_NAME -o custom-columns=\
'NAME:.metadata.name,READY:.status.containerStatuses[*].ready,CONTAINERS:.spec.containers[*].name,NODE:.spec.nodeName'
NAME                            READY                 CONTAINERS                                                              NODE
appliance-router-849f466476-4f5v8   true,true,true,true   appliance-router,s3-uploader,sidecar-reverse-proxy,otel-collector   hyperpod-i-0f3fe2684afd6a583
In our run, the pod was ready about five minutes after kubectl apply, most of it spent downloading the weights.
Step 5: Send a request and confirm captures land in S3
Send an inference request through the capture proxy on port 8081, then, after the flush interval, list the capture prefix. The model itself listens on port 8000. Requests sent there bypass the proxy and are not captured.
POD=$(kubectl get pod -l app=$ENDPOINT_NAME -o jsonpath='{.items[0].metadata.name}')
kubectl port-forward "pod/$POD" 18081:8081 >/dev/null 2>&1 &
sleep 5

curl -s http://localhost:18081/v1/chat/completions \
  -H 'Content-Type: application/json' \
  -d '{"model":"'"$ENDPOINT_NAME"'","messages":[{"role":"user","content":"my fridge is not cooling"}],"max_tokens":24}'

echo "Waiting for the capture buffer to flush..."; sleep 75
aws s3 ls "s3://${BUCKET}/capture/" --recursive | grep '\.jsonl$' | head
2026-09-28 15:47:14     634356 capture/20e4425092f90c7f/pod/AllTraffic/2026/09/28/15/28-15-47-12-999-ac31d31b-5156-46ad-9ccc-e8a040ab9ab2.jsonl
You see one or more .jsonl objects under {s3Uri}/{uniqueID}/pod/{variant}/{YYYY}/{MM}/{DD}/{HH}/. The uniqueID is generated per endpoint. Each line is one inference in the SageMaker data-capture format shown next.
The captured record format
The request and response bodies are stored base64-encoded, as the encoding field shows, so reading them back requires base64-decoding and then parsing JSON:
{
  "captureData": {
    "endpointInput":  { "observedContentType": "application/json", "mode": "INPUT",
                        "data": "eyJtb2RlbCI6ICJyb3V0ZXItZnJlc2giLCAidGVtcGVyYXR1cmUiOiAwLCAi...", "encoding": "BASE64" },
    "endpointOutput": { "observedContentType": "application/json", "mode": "OUTPUT",
                        "data": "eyJpZCI6ImNoYXRjbXBsLTctMTc5MDYxMDM2OS4wMDUtMjMxMiIsIm9iamVj...", "encoding": "BASE64" }
  },
  "eventMetadata": { "eventId": "26859f07-d60b-4683-94aa-d21e7f19e746", "inferenceTime": "2026-09-28T15:46:09Z" },
  "eventVersion": "0"
}
Decoded, endpointInput.data is the request body the client sent and endpointOutput.data is the response the model returned.
The scenario: A support-ticket router meets a product launch
The deployed model is a support-ticket router for a home-appliance retailer. It uses vLLM guided JSON decoding to classify each ticket into one of six categories: ProductFridge, ProductWasher, ProductOven, ProductDishwasher, ProductMicrowave, or the catch-all Other. Guided decoding means it can only return a valid object with one of those labels:
{"category": "ProductWasher", "confidence": 1}After the model was deployed, the retailer launched its own line of air conditioners, the Arctis series (Arctis 9K, 12K, Mini, and so on). The router has no category for them. It can’t say “this is new.” It can only pick the closest label it knows. Unless every request and response is recorded, the evidence disappears the moment the response is returned.
The synthetic traffic
We generated two synthetic datasets:
- Production traffic: 900 tickets, replayed in order through the capture proxy over 15 minutes, using the router’s original six-label prompt. The first 400 come before the launch and mention no air conditioners. In the remaining 500, the share of Arctis tickets ramps from 15% to 55%.
- Evaluation set: 280 labeled tickets, 40 per category, including the new
ProductAC. It is held out by content: it uses symptoms, sentence templates, and Arctis model names that never appear in the traffic.
Each production request looks like this (system prompt abbreviated):
{"model": "appliance-router", "temperature": 0, "max_tokens": 40,
 "messages": [{"role": "system", "content": "You are a support-ticket router for a home-appliance retailer. ... category is one of: ProductFridge, ProductWasher, ProductOven, ProductDishwasher, ProductMicrowave, Other. ..."},
              {"role": "user", "content": "Hi, our Arctis 12K blows warm air since last week. Order #66759."}],
 "guided_json": {"type": "object", "required": ["category", "confidence"],
                 "properties": {"category": {"enum": ["ProductFridge", "ProductWasher", "ProductOven",
                                                      "ProductDishwasher", "ProductMicrowave", "Other"]},
                                "confidence": {"type": "number"}}}}
To replay the traffic, clone the accompanying repository, generate the datasets, and send them through the capture proxy. scripts/pod.sh runs the client inside the model container, so no load balancer or DNS is needed. The client prints the three timestamps that the Athena steps use: RUN_START, LAUNCH_TS (the first post-launch ticket), and RUN_END.
git clone https://github.com/awslabs/awsome-distributed-ai.git
cd awsome-distributed-ai/examples/use-cases/sagemaker-hyperpod-data-capture-flywheel
(cd data && python3 ../scripts/gen_dataset.py)
scripts/pod.sh $ENDPOINT_NAME drive /tmp/tickets_traffic.jsonl --seconds 900
RUN_START=2026-09-28 15:52:40
  sent 100/900
...
LAUNCH_TS=2026-09-28 15:59:20
...
RUN_END=2026-09-28 16:07:40
Export the three values that your run printed, a